Investment Brief – June 2021
Reflection on Inflection
Through May, it became clearer that markets have reached an inflection point, that is, at least for the moment leading to a potential significant inflection point away from the past 15 years investment style. Ironically, it took COVID19 to create anything close to levels of inflation that many a central bank had hoped for. Therefore, it is also rather strange that there is concern building in the market about inflation somehow. After all, is this just what everyone wanted, granted we would have preferred not to have had the tragedy of a global pandemic to bring it about.
Here are a few thoughts on where we find ourselves:
- Finally, the central bankers got just the support from fiscal policy that was so lacking in the past. It was very evident in recent years that economies could not achieve inflation with low to negative interest rates alone. The world needed a burst of excess demand for goods and services, not as we had an excess demand for assets.
- Asset prices until the COVID crisis reflected where we were rather than where policymakers were trying to take us.We wanted to have ‘normal’ inflation – call it 2%, but we got very low inflation or deflation and extremely low interest rates in both real and nominal terms. Growth stocks massively outperformed value stocks, and bonds were in a near-permanent bull market.
- The emergence of a real inflation threat forces asset allocators to make material changes to how they allocate assets. Strategic asset allocation post the global financial crisis was growth equities and bond credit. Strategic asset allocation in an inflation world is value equities, commodities, selective real estate, infrastructure/selective utilities.
The case for a material inflection point is supported by further evidence of inflation moving well beyond market expectations. Secondly, President Biden announced a significant fiscal impulse beyond the end of this year.
After dipping to a low of 1.3% last year, global core inflation has increased back to 2.6% in the four months of this year.JP Morgan economists expect global core inflation to rise 2.5% for the year as a whole putting in a half a percentage point higher than the average of 2018 nineteen. US core inflation is expected to be close to 3% marking the fastest annual increase in prices since 1995.
Recent data releases have shown far more inflation than economists had expected. The Fed’s preferred measure of inflation, the PCE deflator (personal consumption expenditure), saw core inflation (excluding food and energy) at an annualised 3.1% in April. The headline rate rose to 3.6%, a substantial spike from 1.4% in January.
Chart 1: US Personal Consumption Expenditure Core inflation (YoY)
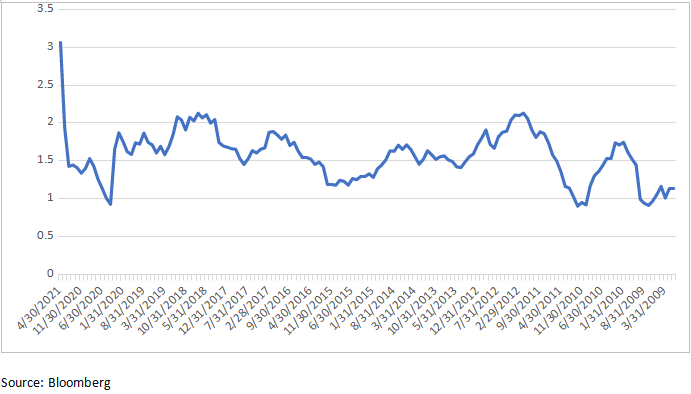
The upward pressures on inflation are very evident in the commodity market, where in the past month, coffee prices were up 16%, onions 15%, maize 12% and iron ore 8%.
We suspect that economists won’t shift from the ‘transitory inflation’ label to current inflation trends until they see clear evidence of wage inflation.The jury is still out on whether we have a material increase in wages at hand. However, recent data has shown more wage inflation and the shortages of labour in the United States. The recent Fed’s beige book – a survey across the US of overall economic conditions commented, “Overall, wage growth was moderate, and a growing number of firms offered signing bonuses and increased starting wages to attract and retain workers. Contacts expected that labor demand will remain strong, but supply constrained, in the months ahead,”.
One driver of global inflation seems to be brewing – a weaker dollar. If the Federal Reserve commits to keeping short-term interest rates anchored at zero beyond the rate rises in other parts of the world, the dollar could come under sustained pressure. The Reserve Bank of New Zealand recently broke ranks to suggest raising rates earlier than previously thought. The market senses the Bank of England is itching to raise rates – hence the recent sharp rise in sterling against the dollar.
The last major inflation shock to the global economy was in the 1970s, when US inflation rose from 2.7% in 1972 to 12.2% in 1974. Then, the devaluation of the USD precipitated a chain of events that was a significant shock to the global economy. Of course, we don’t envisage such disruption as seen in the 1970s, but it is important to recognise that macro factors can sometimes go way beyond the norms of recent experience.
Bottom line – the world is facing more inflation than we have seen for some years. We are more in the camp that believes inflation could hang around and indeed potentially accelerate still further such that it warrants a different way of thinking about asset allocation. Greater commodity exposure and a bias to value stocks is the way to start.
May was a month where equity markets seemed to struggle a bit for direction. Inflation numbers from the US and some other countries began to show that the economic recovery post-Covid may bring inflation to go along with economic growth.
The gains in the MSCI World Index were driven by Europe and value sectors in the US market, as evidenced by the outperformance of the Dow Jones for the month. The tech-heavy Nasdaq index fell 1.5%. At the sector level, the notable outperformance was delivered by the Energy and Materials, gaining 5.8% and 5.0%, respectively. Financials were close behind with 4.8%.
Bond returns for the month were stable for the most part, with the best performance coming from the local-currency Emerging Market, which was up 2.0% on the back of a recovery in the value of many local currencies against the USD this month. Bond yields at the Treasury level were a bit lower over the month, helping the overall market post some modest gains after a challenging start to the year when yields were rising quickly.
There were gains across the board for commodities, except platinum, which dropped 3.1%. Gold and silver saw 6.8% and 5.4% gains, respectively, possibly beginning to price in some inflation risk. The gains registered by commodities and the signs seen in supply chains worldwide are the primary catalysts for both the strong performance of the more cyclical equity sectors.
Table 1: Bond and precious metal returns (%)
| 1 Month | 3 Months | 12 Months | YTD | Yield | |
|---|---|---|---|---|---|
| Global Bond Agg Index | 0.6 | 0.3 | 4.3 | -2.5 | 1.10% |
| Global High Yield Index | 1.0 | 2.1 | 14.6 | 2.1 | 3.85% |
| US Investment Grade ($) | 0.2 | 0.2 | 4.0 | -2.4 | 2.30% |
| Emerging market ($) | 1.0 | 1.3 | 7.1 | -1.2 | 3.90% |
| Gold ($1983) | 5.6 | 10.6 | 11.3 | -0.3 | - |
| Silver ($27.7) | 3.1 | 6.3 | 57.1 | 5.0 | - |
| Dollar Trade weighted | -1.0 | -1.0 | -7.5 | 0.1 | - |
Table 2: Equity markets returns (%)
| Equities | 1 Month | 3 Months | 12 Months | YTD | P/E(F) | Div Yield | |
|---|---|---|---|---|---|---|---|
| US | S&P500 | 0.4 | 10.2 | 34.8 | 12.0 | 22.4 | 1.4% |
| Japan | Nikkei | 0.9 | 0.4 | 28.0 | 5.9 | 20.4 | 1.5% |
| Eurozone | Eurostoxx | 1.5 | 9.4 | 24.2 | 14.3 | 18.6 | 2.2% |
| UK | FTSE-100 | 0.9 | 5.4 | 10.2 | 8.9 | 13.8 | 3.4% |
| Asia ex Japan | MSCI | 2.4 | -1.8 | 41.1 | 6.4 | 16.5 | 1.7% |
| Global | MSCI | 2.5 | 6.4 | 45.7 | 9.7 | 20.2 | 1.7% |
| Emerging Market | MSCI | 3.7 | 0.8 | 40.5 | 7.5 | 14.9 | 1.9% |
DISCLAIMER
This report may contain material that is not directed to, or intended for distribution to or use by, any person or entity who is a citizen or resident of or located in any locality, state, country or other jurisdiction where such distribution, publication, availability or use would be contrary to law or regulation or which would subject Delft Partners or its affiliates ("Delft") to any registration or licensing requirement within such jurisdiction. All material presented in this report, unless specifically indicated otherwise, is under copyright to Delft. None of the material, nor its content, nor any copy of it, may be altered in any way, transmitted to, copied or distributed to any other party, without the prior express written permission of Delft. All trademarks, service marks and logos used in this report are trademarks or service marks or registered trademarks or service marks of Delft or its affiliates. This report is intended to provide the recipient with general market advice it should not be relied upon to make investment decisions or be construed as an inducement to trade. This report is only for the use of professional investors defined in s.708 Corps Act. Information and opinions presented in this report have been obtained or derived from sources believed by Delft to be reliable, but Delft makes no representation as to their accuracy or completeness. The information, tools and material presented in this report are provided to you for information purposes only and are not to be used or considered as an offer or the solicitation of an offer to sell or to buy or subscribe for securities or other financial instruments. Delft will not treat recipients of this report as its customers by virtue of their receiving this report. The investments and services contained or referred to in this report may not be suitable for you and it is recommended that you consult an independent investment advisor if you are in doubt about such investments or investment services. Delft accepts no liability for loss arising from the use of the material presented in this report, except that this exclusion of liability does not apply to the extent that such liability arises under specific statutes or regulations applicable to Delft. This report is not to be relied upon in substitution for the exercise of independent judgment. Delft may have issued, and may in the future issue, other communications that are inconsistent with, and reach different conclusions from, the information presented in this report. Those communications reflect the different assumptions, views and analytical methods of the analysts who prepared them, and Delft is under no obligation to ensure that such other communications are brought to the attention of any recipient of this report Past performance should not be taken as an indication or guarantee of future performance, and no representation or warranty, express or implied, is made regarding future performance. Information, opinions, and estimates contained in this report reflect a judgment at its original date of publication by Delft and are subject to change without notice. In the case of some investments the potential losses may exceed the amount of initial investment and, in such circumstances, you may be required to pay more money to support those losses. Some investments may not be readily realisable, and it may be difficult to sell or realise those investments, similarly it may prove difficult for you to obtain reliable information about the value, or risks, to which such an investment is exposed. This report may provide the addresses of, or contain hyperlinks to, websites. Except to the extent to which the report refers to website material of Delft, Delft has not reviewed any such site and takes no responsibility for the content contained therein. Such address or hyperlink (including addresses or hyperlinks to Delft's own website material) is provided solely for your convenience and information and the content of any such website does not in any way form part of this document.