Global Listed Infrastructure October 2021 Monthly Commentary
“The whole problem with the world is that fools and fanatics are always so certain of themselves and wiser people so full of doubts.” – Bertrand Russell
October was a positive month for global stock markets. In the US markets shook off the softness from September to push to new highs. The strategy underperformed the benchmark by over 1.5%. Much of the underperformance to the benchmark can be attributed to the lack of exposure to US Telecommunication Tower operations such as American Tower, Crown Castle and SBA communications the three largest weightings in the MSCI Core Infrastructure Index. Tower operators are benefiting primarily from the 5G build out in the US. We see most of this topline growth being a temporary ‘sugar hit’ rather than a prolonged period of sustained earnings growth sufficient to justify the earnings multiple.
As expected, the Fed announced that it will taper its bond monthly bond purchases of US$120bn at a rate of US$15bn per month. The announcement of the Fed’s tapering plans created a mild bond sell off predominantly at the back end of the curve with the US10yr briefly moving above 1.6%. The tapering process is set to begin in mid-November suggesting stimulus will cease by June 2022. The transitory inflation narrative remains but rising rents, wage pressures and a shortage of workers suggest that supply chain disruptions are not the sole driver of inflation. Even if the rate of price increases abates, prices are not coming back to where they were. Inflation expectations are now being embedded; good for equities in the short run.
Biden’s US$1.2bn infrastructure bill has passed The House after passing The Senate in August. The package will provide a much needed spend on vital US assets many of which have fallen into a state of disrepair; laid bare by recent supply chain issues felt across the US. The specifics of how this will be distributed is still a mystery and the bill may not be the boon for the private sector that many are anticipating. For example, the US$65bn in new taxpayer money that will be allocated to expand high-speed internet access to unconnected and underserviced areas would be unlikely to woo large telcos such as Verizon and AT&T. Considering that c.US$68bn was spent by Verizon and AT&T at February’s mid-band spectrum auction, their focus will most likely continue in urban areas where returns on investment are greater.
Fiber providers such and Lumen and Frontier may participate in the package having previously benefited from the Connect America Fund II. Since mandates to extend coverage beyond current expansion plans would potentially damage profitability for these operators, the strategy remained underweight in the communications sector through October.
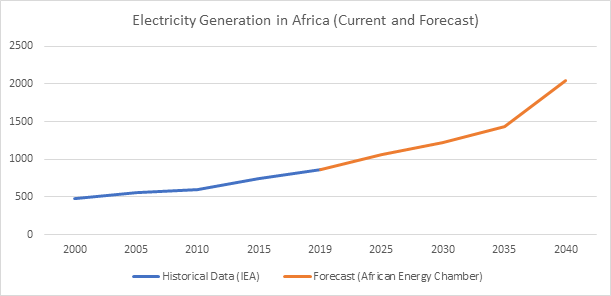
The transition to cleaner energy could not have been handled more badly. Until renewables can take up the seasonal and diurnal fluctuations in demand and supply it would have made sense to essentially turn to increasing the sourcing and development of cleaner existing fuels such as gas and to expand nuclear technology to manage the transition. Natural gas prices have stabilized at very high prices in Europe and remain elevated albeit at lower levels, in the US. Moving into seasonal peaks in demand, US and UK power companies had to follow China in restarting coal-fired power plants. US Coal miners have sold the bulk of their 2022 thermal coal output up to 20% above spot prices1. Global coal demand is on course to rise 4.5% in 2021, with more than 80% of the growth concentrated in Asia. Coal demand is projected to increase by 60% more than all renewables combined which will lead to a rise in emissions of almost 5%2. The UN continued to push for new signatories to the No New Coal pact at COP26 a noble goal considering the reduction in air quality in the world’s largest cities. Often overlooked in many of these pledges is that compared to US energy consumption per capita, India consumes around 7.5%, Indonesia 7.7% and Africa less than 6%. The base case for African energy increases is 25% on 2020 levels by 2025 to 1057 TWh per annum an increase equivalent to the average annual output of 340m photovoltaic panels3. It is population growth and rising living standards in non-OECD countries that are producing the rising emissions. With a consequent increase in energy demand coming from developing economies, if not coal then what?
Storage solutions for renewables are either not available or not feasible on the scale required to provide adequate back up to the grid. Nuclear? Nuclear certainly provides a compelling argument, however technical and working capital requirements are perhaps out of the reach of most developing nations.
Natural Gas? With 50% fewer carbon emissions than coal, natural gas will perhaps be the only alternative for developing nations to electrify supply. We see gas utilities, pipelines, and storage providing the backbone of the energy mix for years to come even if Nuclear is approved tomorrow, and maintain an overweight position in these in the strategy.
In China, the economy showed further signs of weakness with electricity shortages pushing manufacturing PMIs to the lowest levels since March 2020. Turmoil in the property market also continued to provide a significant drag on the economy. Gas Utilities in China experienced a difficult month as news flow around regional consumption caps created uncertainty amongst investors. Despite the raft of issues surrounding China, we believe ‘useful’ companies such as utilities, ports and shipping will hold up well relative the rest of the economy. We maintain an overweight position in China infrastructure assets.
Notable performers in the index during October were US railroads with CSX (21.6%), Union Pacific (23.2%), and Norfolk Southern (22.5%) benefiting from supply chain disruptions. Spanish diversified electric utility Iberdrola (17.6%) bounced during the month following uncertainty in September regarding the Spanish ‘Windfall Tax’.
Chinese gas utilities Kunlun Energy (-12.3.%) and China Gas Holdings (-15.4%) were the worst performing stocks following the Chinese power crunch and intervention from Beijing. China Gas also struggled for investor support following a gas explosion in Shenyang operated by Shenyang Shenxi Gas which China Gas indirectly owns ≈32%.
During October, the strategy added exposure to US oil and gas pipelines through Cheniere. The Finnish energy company Fortum was also added to increase exposure to nuclear power generation technical production and skills. The strategu remains overweight in Gas Utilities, Air Freight and Logistics, and Rail Roads.