August 2022 Update
The old adage that the equity market exists to deal out the maximum pain to the maximum number of investors, held true again in July. Short covering, risk on, a reappraisal of interest rate trends, whatever, drove the US and major international markets higher in July. Our philosophy of not timing equity market exposure again paid off and we managed to capture a large part of the bounce in equities which was essentially dominated by expensive ‘junk’
The diversified global trust rose just over 4.5% and the more value oriented GHC 30 portfolios rose just over 2%. The market capitalisation equity index rose 6.4% dominated by the aforesaid ‘junk’ and the value-oriented index rose 3.2%.
Encouraging noises from Japan about a reopening there saw the Yen bounce a little off a very depressed and undervalued level, and some signs of improved economic activity.
It's time for a bit of a medium-term perspective and some sober thoughts.
We have put together a dataset to show the contrast between where we were about eight months ago and where we are today (Table 1). Put simply, the prospect of growth is much more dismal today than what was forecast earlier – for much higher interest rates. Let's also not forget the significant geopolitical disruption caused by the Ukraine war and the recent sabre-rattling over Taiwan that has reversed globalisation.
Table 1: What’s changed? – Quite a lot!
| 31st Dec 2021 | 12th Aug 2022 | Change | |
|---|---|---|---|
| US Inflation | 7.0% | 8.5% | +150bps |
| US 10-year | 1.51% | 3.28% | +177bps |
| US 2-year | 0.73% | 3.24% | +251bp |
| Brent ($bbl) | $77.1 | $98.2 | +27.4% |
| Global High Yield (YTW) | 4.85% | 8.11% | +326bps (-11.7%*) |
| S&P500 | 4766 | 4280 | -10.2% |
| MSCI World ($) Index | -11.4% | ||
| ISM Manufacturing (Index) | 58.8 | 52.8 | -6.0 |
| ISM Services (Index) | 62.3 | 56.7 | 5.6bps |
| US unemployment | 4.23% | 3.60% | -0.63bps |
| US 30-year mortgage rate | 3.27% | 5.53% | +69% |
| Consensus US GDP forecast 2022 | 3.90% | 1.10% | -280bp |
| Consensus US GDP forecast 2023 | 2.50% | 1.10% | -140bps |
Source: Bloomberg
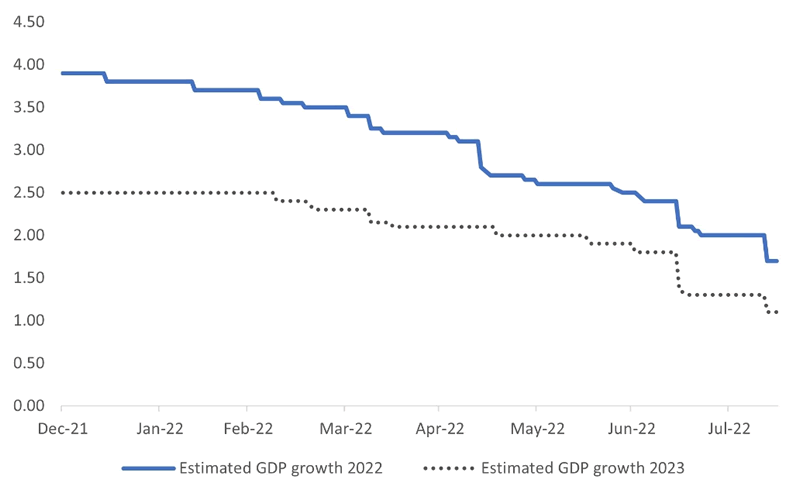
From the equity market peak in December 2021, the consensus US GDP forecast for 2022 has fallen 2.8 percentage points.
The current growth forecast of just 1.7% looks miserable compared with the vibrant economy implied by the growth estimates of 3.9% at the start of the year. Consensus growth forecasts for 2023 haven’t witnessed an equally dismal fall, but they are still near the 1.1% level for the year.
Consensus US GDP Forecasts on the slide
Source: Bloomberg
With such tepid prospects for growth, how can corporate earnings still be holding up? To be honest, the headline that US corporate earnings held up well in the first quarter was a bit of a misrepresentation of facts. While the energy sector accounted for much of the surprise, other sectors were not so vibrant. Indeed, although the aggregate US quarterly earnings beat expectations (as they always do), analysts have been busy cutting their earnings forecasts for 2022. The US indicator of the ratio of upgrades to downgrades for the S&P500 companies’ earnings has fallen sharply. The positive-to-negative EPS revisions ratio has fallen to -50% from +40% at the start of the year.
Earnings revisions by region – US on the slide
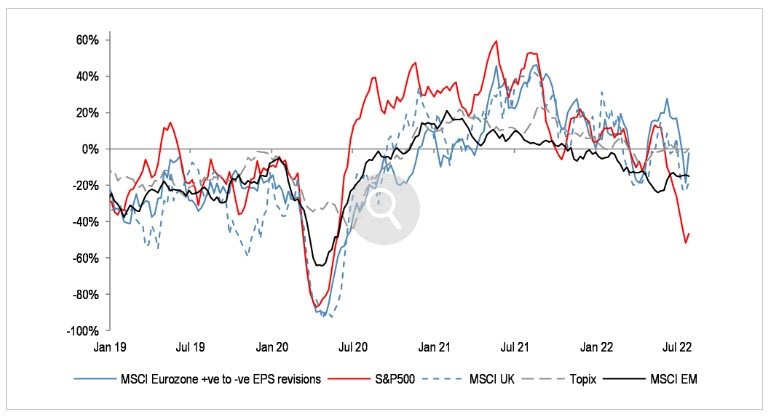
Source: IBES and JPMorgan
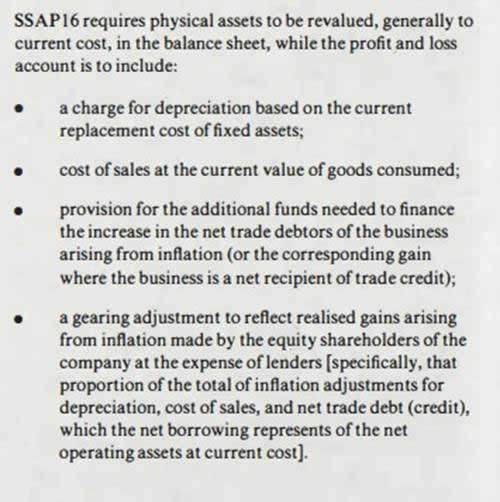
It is important to bear in mind that inflation can severely distort the apparent financial health of companies. Higher inflation levels can also lead to the illusion of strong profit growth. It is the phenomenon of stock profits. As inflation picks up, companies react by increasing prices. Companies benefit by buying inventory cheaply and selling at inflated prices. If we go back to the 1970s, the UK accounting standards board was set to introduce SSAP16 to account for inflation so that companies would not overstate their profits (See Exhibit 1). However, the moderation of inflation led to the mothballing of the accounting standard shortly after.
A Snapshot of UK Accounting Standard for inflation (Proposed late circa 1970’s)
So, when we reflect on the market backdrop, we must ask ourselves if that squares with the 15% rally in the markets, leaving equities down only about 10% for the year? It's worth recalling that the S&P500 rallied by close to 15% between March and June 2008 before witnessing that dramatic plunge.
When set, inflation is sticky. It took the US about 4 years after WW2 to get inflation down to about 6% from over 20% once price controls came off. This inflation saga is not over yet.
We would also reiterate here that we are just over six months into the Ukraine war that disrupted the global economy. Therefore, it is still far too early to say that we have seen the full impact of the war on global growth and inflation. Europe, for instance, is still waiting with trepidation to see what the energy situation will be in the winter, with the prospect of significant disruption to energy supply and a further increase in energy prices looming large. This will impact the consumer.
On a recent trip to Germany, the UK, and Denmark/Scandinavia, we observed and had verified verbally, that discretionary spending is going down.
The impact of higher interest rates will build only slowly, but it will build. No one could argue that the nearly 70% increase in the US mortgage rate will not significantly impact the housing market there. In other countries fixing a mortgage perpetually is not possible and so a reset is coming faster to the UK, Australia and other ‘Anglo Saxon’ economies.
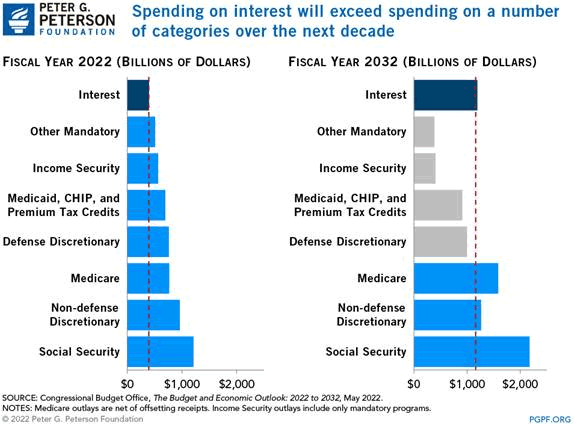
Our stance? Don’t chase this rally but bear in mind that countries can’t afford for interest rates to turn too positive. Even with the recent modest rise in government bond yields the projected US interest bill will exceed the defense and education budgets.
Such a fiscal drag is not tenable so prepare for negative real rates and a lot of regulation/taxation – possibly including regulation on interest rates. The best beneficiaries of inflation (if modest) are equities which represent claims on real assets especially those with a low elasticity of demand for their products.
Consequently, favour companies that meet needs and not wants since they will be least affected by any government confiscation. For example evidence abounds of the need to repair and improve infrastructure in almost all Western countries – droughts in California in the USA and the whole of the UK for example are assigned to climate change but the fact that populations have grown strongly (both by over 10m in the last 20 years) and neither has built a new reservoir for almost 30 years, and that THIS is a root cause of water shortages. cannot surely escape the attention of even the most wilfully blind politician for ever?
For our current top 10 positions and equity positioning in our 3 strategies please visit our website www.delftpartners.com
We also write some topical thematic pieces; currently focussing upon the cost of Zero Carbon (unaffordable and sub optimal) as well as the likely trajectory of “new improved” (sic) government intervention after the failure of ZIRP.
Delft Partners August 2022
DISCLAIMER
This report provides general information only and does not take into account the investment objectives, financial circumstances or needs of any person. To the maximum extent permitted by law, Delft Partners Pty Ltd, its directors and employees accept no liability for any loss or damage incurred as a result of any action taken or not taken on the basis of the information contained in the report or any omissions or errors within it. It is advisable that you obtain professional independent financial, legal and taxation advice before making any financial investment decision. Delft Partners Pty Ltd does not guarantee the repayment of capital, the payment of income, or the performance of its investments. Delft Partners operates as owner of API Capital Advisory Pty Ltd AFSL 329133.