Water Infrastructure in China
January 17, 2020
By Kevin N. Smith, Delft Partners
Kevin Smith takes a look at the development of water management infrastructure in China and key listed company in the sector, plastic pipe manufacturer China Lesso Group Holdings Limited.
China is well known for having a large spend on infrastructure projects, Table One shows the international comparison as a percent of GDP in the years 2010 to 2015. That high level of spending will continue for decades to come. Oxford Economics have projected total spending in China of USD 26.5 trillion in the period 2016-2040 (2015 USD values and exchange rates). The big-ticket items for China are road, rail and electricity infrastructure which together account for more than 70% of the spend.
Table One: Infrastructure spend 2010-2015 as a percent of GDP
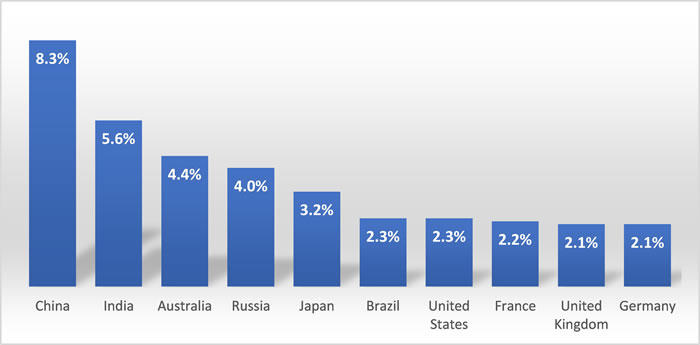
Source: Statista
The focus of this article is spending directed at water infrastructure and the implications for one of our investments in particular the Hong Kong listed China Lesso Group Holdings Limited (Lesso), a company that has the distinction of being our best performing investment in 2019, rising 145% from our point of entry in late 2018. Water accounts for less than 5% of total infrastructure spending, however, the sums involved are nevertheless substantial. Oxford Economics estimate that total spending on water infrastructure in the period 2016-2040 will be in excess of USD 1 trillion. China faces some serious challenges with respect to the management of water resources, but it isn't the crisis that is frequently depicted in the Western media. China has 6% of the global water resource and 9% of the world's arable land and is required to feed 21% of the global population.
The per capita water availability of 2,100 m3 in China is less than one quarter of the world average, moreover the resource is spread very unevenly across the country making it very difficult to balance supply and demand. There is a marked difference in rainfall patterns with the South and East regions able to be predominately rainfed for farming while the North and West require irrigated farming. Irrigation consumes 65% of all water use in China. North China has 60% of the national cropped area, 40% of the population and just 20% of the national water resources. Table Two illustrates the growing demand for water since the beginning of the Communist era in 1949. In 1949 there were just 1,200 reservoirs in China, by 2018 that number had increased to 98,000 while at that time the United States had 84,000 reservoirs. China may have a sufficient quantity of reservoirs however 13.400 are deemed to be too small.
Table Two: The Growth of Water Usage in China
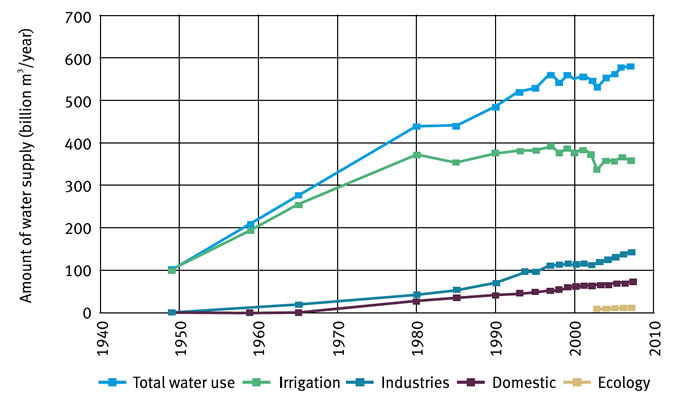
Source: Global Water Partnership "China's water resources management challenge"
Water consumption for industrial purposes has trebled since the wave of market reforms were introduced in the early 1980s. The value of industrial output from each m3 is one third of the world average and GDP output from each m3 is one fifth of the world average. China has plenty of scope for improved efficiency in the use of their water resources. The first serious attempt to introduce better water management was the Water Law of 2002 which was followed by a broader water management strategy from 2009 and the announcement of "three red lines" which capped total water usage at 700bn m3 and set targets for efficiency of use and the control of pollution. Progress in the initial years was little to non-existent, however, that changed when the implementation was directed towards pilot projects at the local level with clear areas of accountability. Efficiency targets looking out to the year 2030 are shown in Table Three, it can be seen that the area requiring the biggest improvement is water consumption per unit of industrial value added.
Water management planning and funding now receives significant emphasis in the five-year planning cycle. The 13th Five Year Plan (FYP) is due to end this year and there will be a new round of targets announced the 14th FYP. This backdrop of State planning and funding allows the private sector to implement long-term plans with a high degree of certainty regarding levels of demand. The breakdown of current spending directed at water resources is shown in table four.
Table Three: Water Efficiency Targets in China for 2030
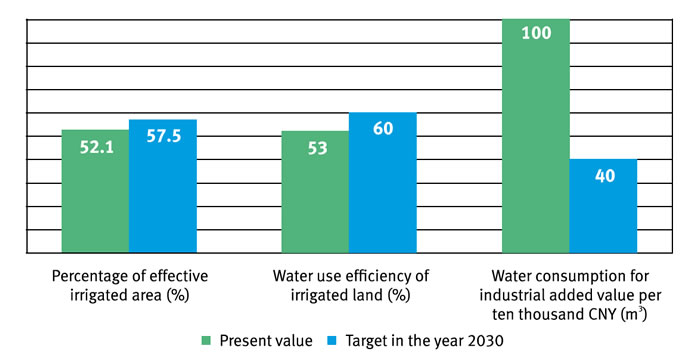
Source: Global Water Partnership "China's water resources management challenge"
Table Four: Water Resource Management Allocation of Budget
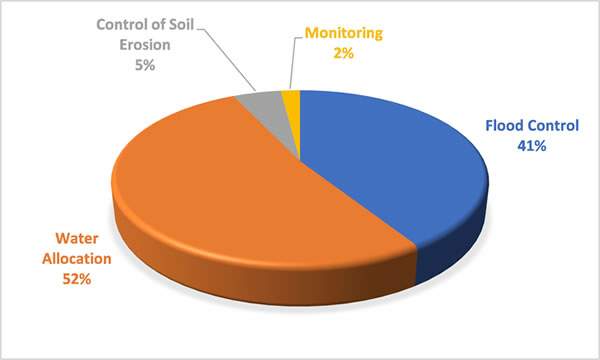
Source: Ministry of Water Resources
Lesso is a manufacturer of plastic pipes which are largely supplied to the domestic markets for water and gas in China. Table Five shows the distribution of Lesso's production facilities in 23 locations across 16 provinces in China. Lesso has been able to coordinate their expansion of production facilities with the various FYPs, most recently the 13th FYP covering 2016-2020 indicated demand volumes increases of 3% per annum. Lesso has total production capacity of 2.7 million tonnes which is significant in the context of total capacity of 16 million tonnes in China. While the percentage volume increase isn't high, the supplier companies like Lesso can place high confidence in the demand profile. During the 13th FYP a total of 93,000km of pipeline was planned for the water supply network and 23,000km of replacement pipelines. The demand profile of these new pipelines is directed at the urbanization of the interior of China and Lesso has developed their manufacturing profile accordingly.
Table Five: China Lesso's Production Facilities Across China
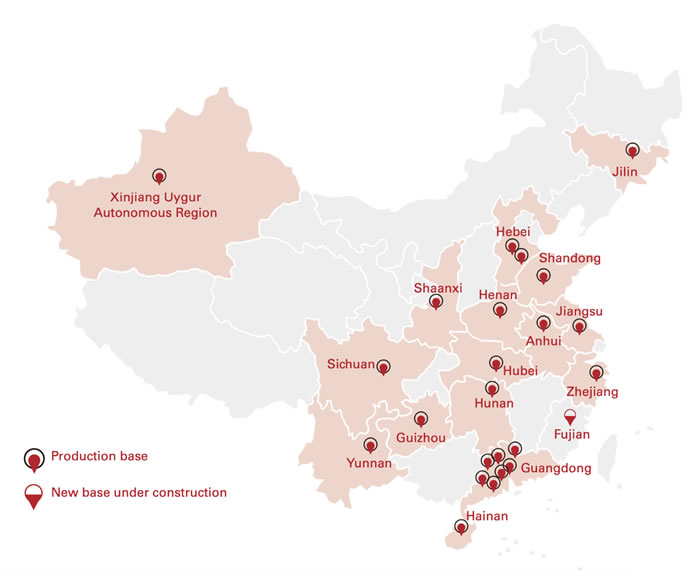
Source: China Lesso Interim Report 2019
Lesso's sales are generated through a network of exclusive distributors which provides a secure distribution platform within China. Government measure to reduce water pollution is providing a demand stimulus for replacement pipelines. Total investment of RMB 4.6 trillion (USD 665 billion) is planned for pollution control in the next five years. Demand for pipes is split across new water supply (23%), new urban rainwater pipelines (28%), centralized heating network (10%), new gas pipelines (33%) drainage and replacement of old pipelines (6%).
Plastic pipes account for 90% of Lesso's sales and given the level of ongoing demand for plastic pipes there is no need to aggressively pursue diversification opportunities. The company has a limited international programme and an investment in aluminium products.
Table Six shows the very strong performance of the Lesso shares in the past year. Lesso remains an attractive company trading on a 2020 P/E ratio of 8.9x and a yield of 3.7%. There is a manageable amount of debt on the balance sheet and a very strong return equity of close to 19%. At the interim reporting stage in 2019 the company reported revenue growth of 6.6% and gross profits growth of 17.6%. The company has delivered strong outcomes against a relatively muted backdrop of economic activity in China. The company has initiated a process of increasing their levels of factory automation which has been a large component of the delivery of profit growth and margin improvements. The interim reporting also indicated significant emphasis is being placed on Lesso's environmental protection business with strong growth expected from the current level of 5% of gross profits.
Table Six: China Lesso Chart and Key Ratios
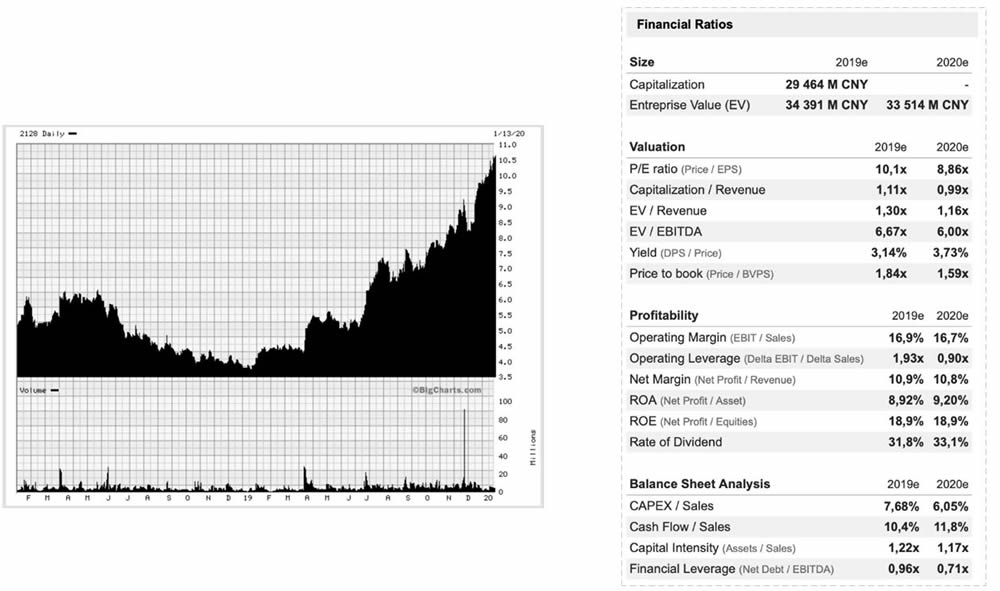
Sources: Market Screener and Big Charts
In conclusion, China has serious water management problems especially with distribution and the large demand supply imbalance between the North and South. China will devote increasing funding towards the problems of water quality and pollution. Water supply is not, as frequently suggested, a constraint on economic growth in China. Steps have been taken to create a near-national water grid so that water availability isn't a critical constraint on economic development. There is evidence that adjustments in the pricing of water to industry is having the desired impact on efficiency of usage. The demand profile for water infrastructure will remain strong in the next few decades which provides a positive backdrop for companies like Lesso that have a part to play in the delivery of water to agriculture, industry and especially urban consumers.